1.5 Million Australian Homes at Climate Risk: Checks, Risk Modelling
More than 1.5 million Australian homes now sit in high or very high climate risk zones, and government modelling suggests roughly a million of them could be effectively uninsurable by 2050. If you’re buying, selling, or holding property, the immediate move is simple: check the exact address on the Climate Council’s risk map and the national assessment tools before you factor in price, insurance, or loan terms. This isn’t a distant problem. It’s already showing up in premiums and valuations.
TL;DR:
- Nearly 1.5 million Australian homes are in high or very high climate risk zones, with about 1 million potentially uninsurable by 2050.
- Property values could decline by up to A$611 billion as insurance premiums rise and coverage becomes harder to obtain.
- Checking hazard maps and local flood or bushfire overlays is essential before buying or selling in exposed areas.
- Retrofitting measures can lower insurance costs and increase resilience, but retreat is often the only option in permanently affected sites.
- Monitoring insurer withdrawal signals and government zoning updates helps anticipate shifts in property risk and insurability.
Table of Contents
- What does climate risk property Australia data actually show?
- How does climate risk change property prices and insurance access?
- How do you check the climate risk for a specific address?
- A checklist for buying, holding or investing with climate risk in mind
- Practical ways to make a property more resilient
- What should you watch over the next few years?
- How Wealthstacker helps you model climate risk before you buy
- Sources
What does climate risk property Australia data actually show?
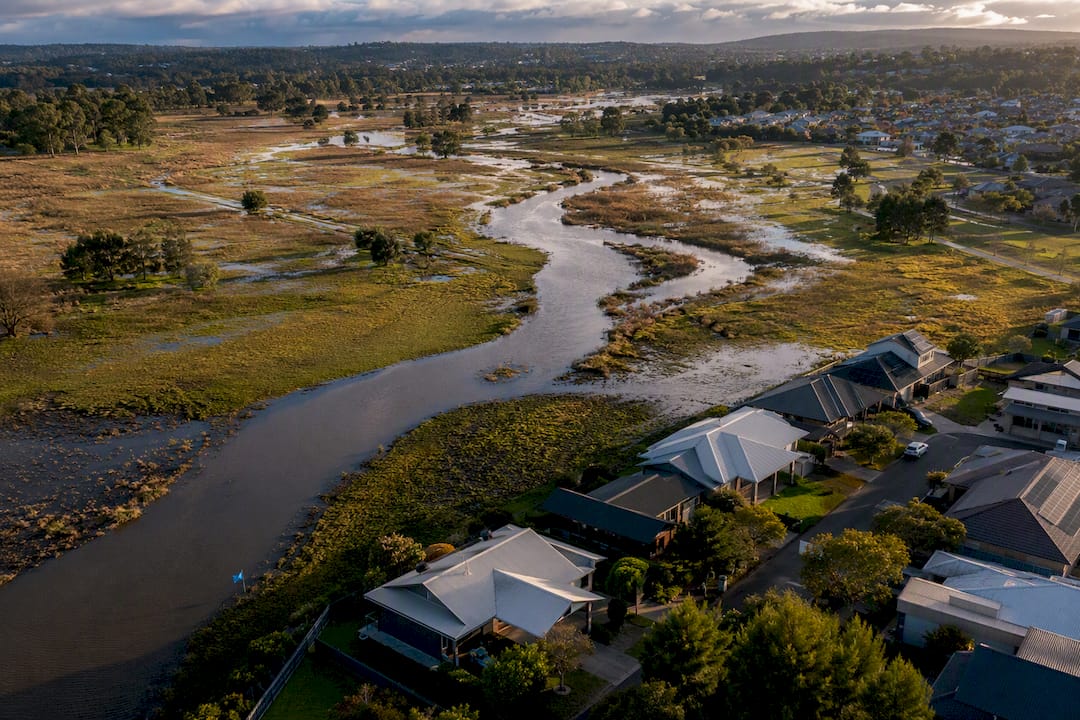
The 2025 National Climate Risk Assessment is the most detailed picture we’ve had of climate risk property Australia wide, and the numbers are blunt. Roughly 8.2% of residential buildings (about 751,000) sit in “high risk” areas, with another 8.7% (around 794,000) in “very high risk” zones, according to the Climate Council’s summary of the assessment. That’s already over 1.5 million homes today, before you factor in growth projections.
The forward numbers are what should get attention:
- Around 1 million homes could become effectively uninsurable by 2050.
- Aggregated property-value losses could reach roughly A$611 billion by 2050 under a higher warming scenario.
- Coastal buildings alone carry up to $63 billion in replacement value exposed to a 1.1-metre sea-level rise, affecting somewhere between 157,000 and 247,600 individual buildings.
The assessment covers flood, bushfire, cyclone, extreme heat, and sea-level rise, but it’s scenario modelling, not a prophecy. Different states measure flood exposure differently too. Some model 1-in-100-year storm tides, others use high-water events, so comparing risk ratings across state lines needs care.
How does climate risk change property prices and insurance access?
Climate risk affects property value long before a hazard event actually happens. Once buyers, valuers, and insurers can see the exposure on a map, that risk gets priced in, whether or not a flood or fire ever hits.
Insurance affordability is the earliest and clearest signal of this repricing. When premiums start eating a large share of household income, properties become harder to sell and harder to finance. Research from the United States, applied to a similar dynamic here, shows premium stress reduces liquidity well before a formal insurer withdrawal happens.
Three things tend to happen in sequence:
- Insurers quietly raise premiums or add exclusions for flood, bushfire, or cyclone cover in exposed postcodes.
- Buyers and valuers start discounting asking prices in areas where insurance is expensive or hard to get.
- Lenders tighten terms or decline finance where a property can’t get adequate cover, which restricts turnover.
Government and industry briefings describe this as a cascading effect: insurance retreat drags on mortgage access, which drags on local property turnover and eventually on regional economic activity, according to Grant Thornton’s analysis of the assessment.
Pro Tip: Ask for the current insurance policy and claims history before you make an offer, not after. A property with a recent flood claim or an insurer exclusion clause is a different asset to the one the listing photos suggest.
How do you check the climate risk for a specific address?
You don’t need to guess. Several free Australian tools let you check a specific property against modelled hazards, and running the checks in this order gets you the clearest picture:
- Start with the Climate Council’s Climate Risk Map, which lets you search an address and see flood, bushfire, cyclone, and extreme heat exposure at a glance.
- Cross-check the National Climate Risk Assessment’s own mapping for the broader hazard categories and scenario assumptions behind the headline figures.
- Pull rainfall, sea-level, and heat projections from the Bureau of Meteorology’s Australian Water Outlook to understand which climate scenario (and which decade) a rating is actually based on.
- Check your council’s own flood studies and bushfire overlay maps, because parcel-level planning constraints (like minimum floor heights or bushfire attack level ratings) sit at the local government level, not the national one.
- Save a screenshot of every result. You’ll want this evidence later for insurers, valuers, or lenders.
A checklist for buying, holding or investing with climate risk in mind
Score any property you’re seriously considering against five factors: hazard exposure, current insurance cost and availability, likely adaptation spend, resale liquidity, and local planning or retreat risk. A property that scores poorly on two or more of these is worth a harder look before you commit.
Ask direct questions, and expect direct answers:
- Ask the agent for the seller’s current insurance premium and any claims made in the last five years.
- Ask the insurer whether flood, cyclone, or bushfire cover carries exclusions or excess loadings for that specific address.
- Ask the council for its most recent flood study and whether the property sits inside a floodway or flood-fringe overlay.
- Ask the lender whether the property’s hazard rating affects loan-to-value ratio or requires additional conditions.
Pro Tip: A council flood study that’s more than five years old is a red flag on its own. Ask when it was last updated, and ask what changed.
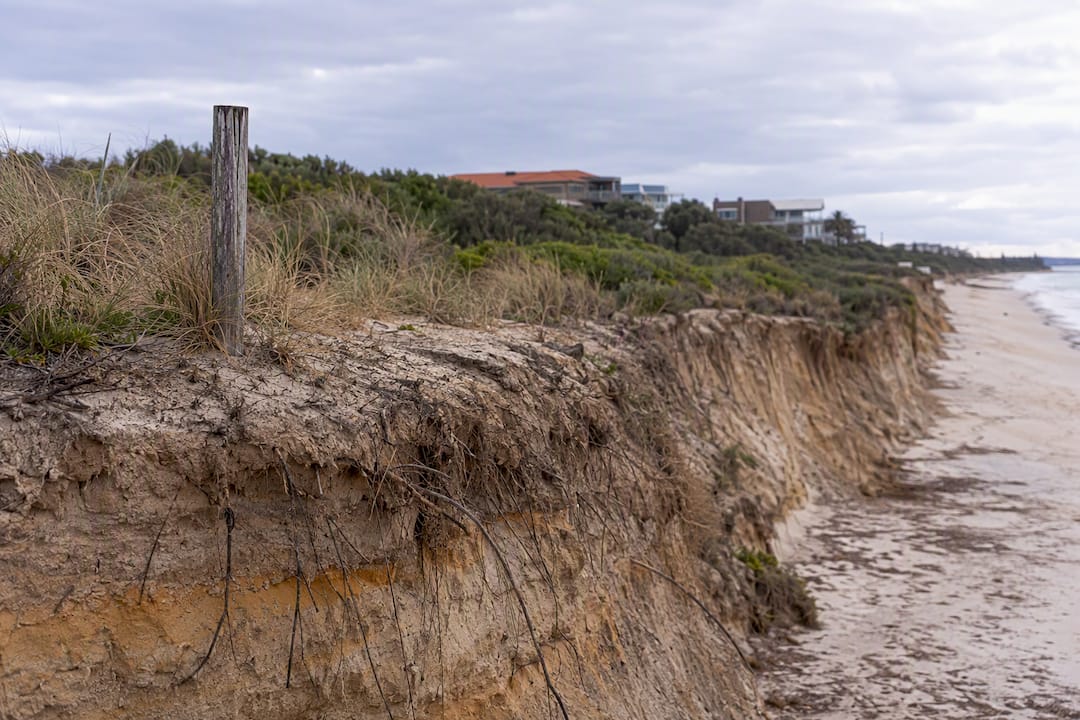
Watch for these red flags specifically: an explicit insurer exclusion for a named hazard, council restrictions on rebuilding after a disaster, a pattern of repeated local claims in the same street, or noticeable coastal erosion within a few hundred metres. None of these are automatic deal breakers, but each one should shift your offer price or your walk-away point.
Practical ways to make a property more resilient
Retrofitting reduces both loss exposure and, often, insurance cost, and documented upgrades can genuinely lower premiums when insurers or valuers recognise the work.
For flood-prone properties, that means raising electrical switchboards and power points above likely flood height, and using water-tolerant materials like tiles and treated timber on lower levels instead of carpet and MDF. For bushfire zones, ember-proofing (metal mesh over gaps, sealed eaves, non-combustible gutters) paired with defensible space around the building does most of the heavy lifting.
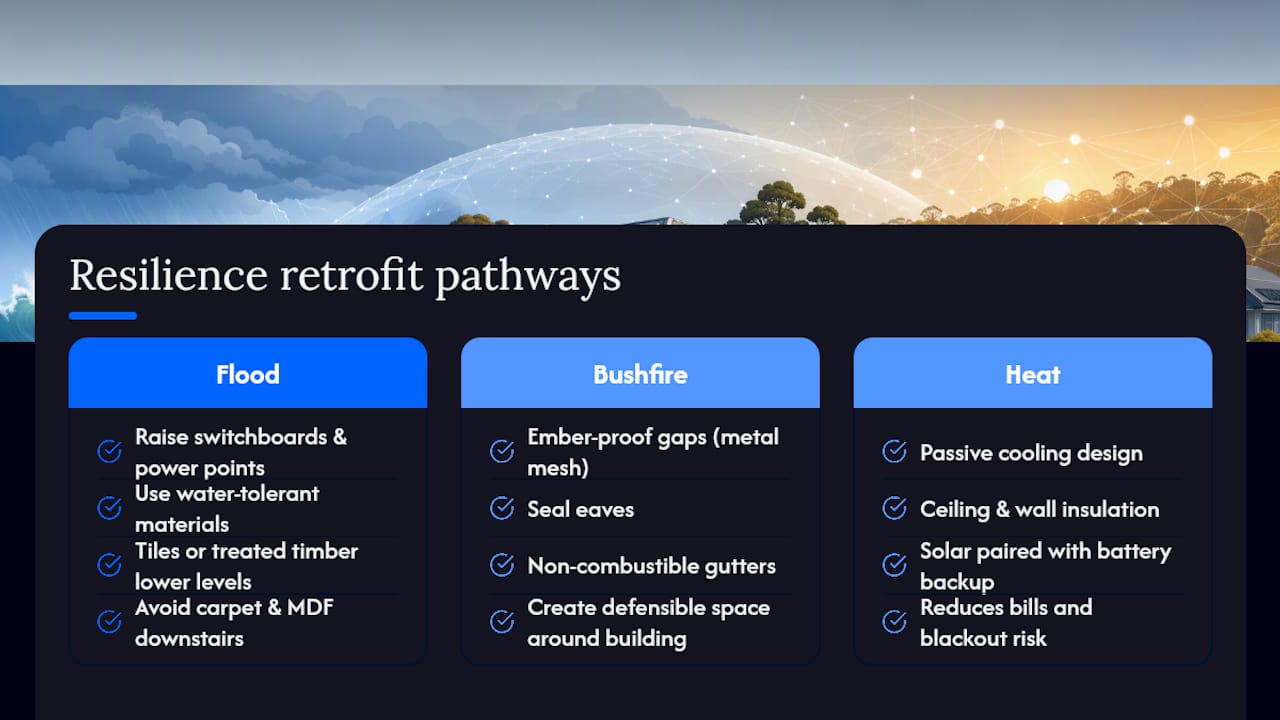
Heat resilience matters more every year: passive cooling design, ceiling and wall insulation, and solar paired with battery backup all reduce both bills and blackout risk during extreme heat events.
Retrofit makes sense when the hazard is manageable and the property’s location has long-term value. Retreat becomes the sensible option when erosion, repeated flooding, or insurer exclusions are already permanent features of the site, not temporary setbacks. Whatever you do, keep receipts and certification. Insurers and valuers can’t credit an upgrade they can’t verify.
What should you watch over the next few years?
Three signals move faster than the headline statistics: insurer product withdrawals from specific postcodes, new lender policies tightening loan conditions on high-risk addresses, and council zoning or building-code updates following floodplain remapping. Each tends to arrive quietly, through a policy notice or a council gazette, well before it becomes news.
The National Emergency Management Agency’s hazards insurance partnership is worth monitoring directly, since insurer bulletins often move before formal lender changes catch up. If you’re planning to buy or sell in an exposed area, treat any of these three signals as a trigger to re-run your risk checks and adjust your timeline, not something to wait out.
How Wealthstacker helps you model climate risk before you buy
Reading a hazard map tells you a property is exposed. It doesn’t tell you what that exposure does to your cash flow, your insurance costs, or your fifteen-year return. That’s the gap Wealthstacker is built to close.
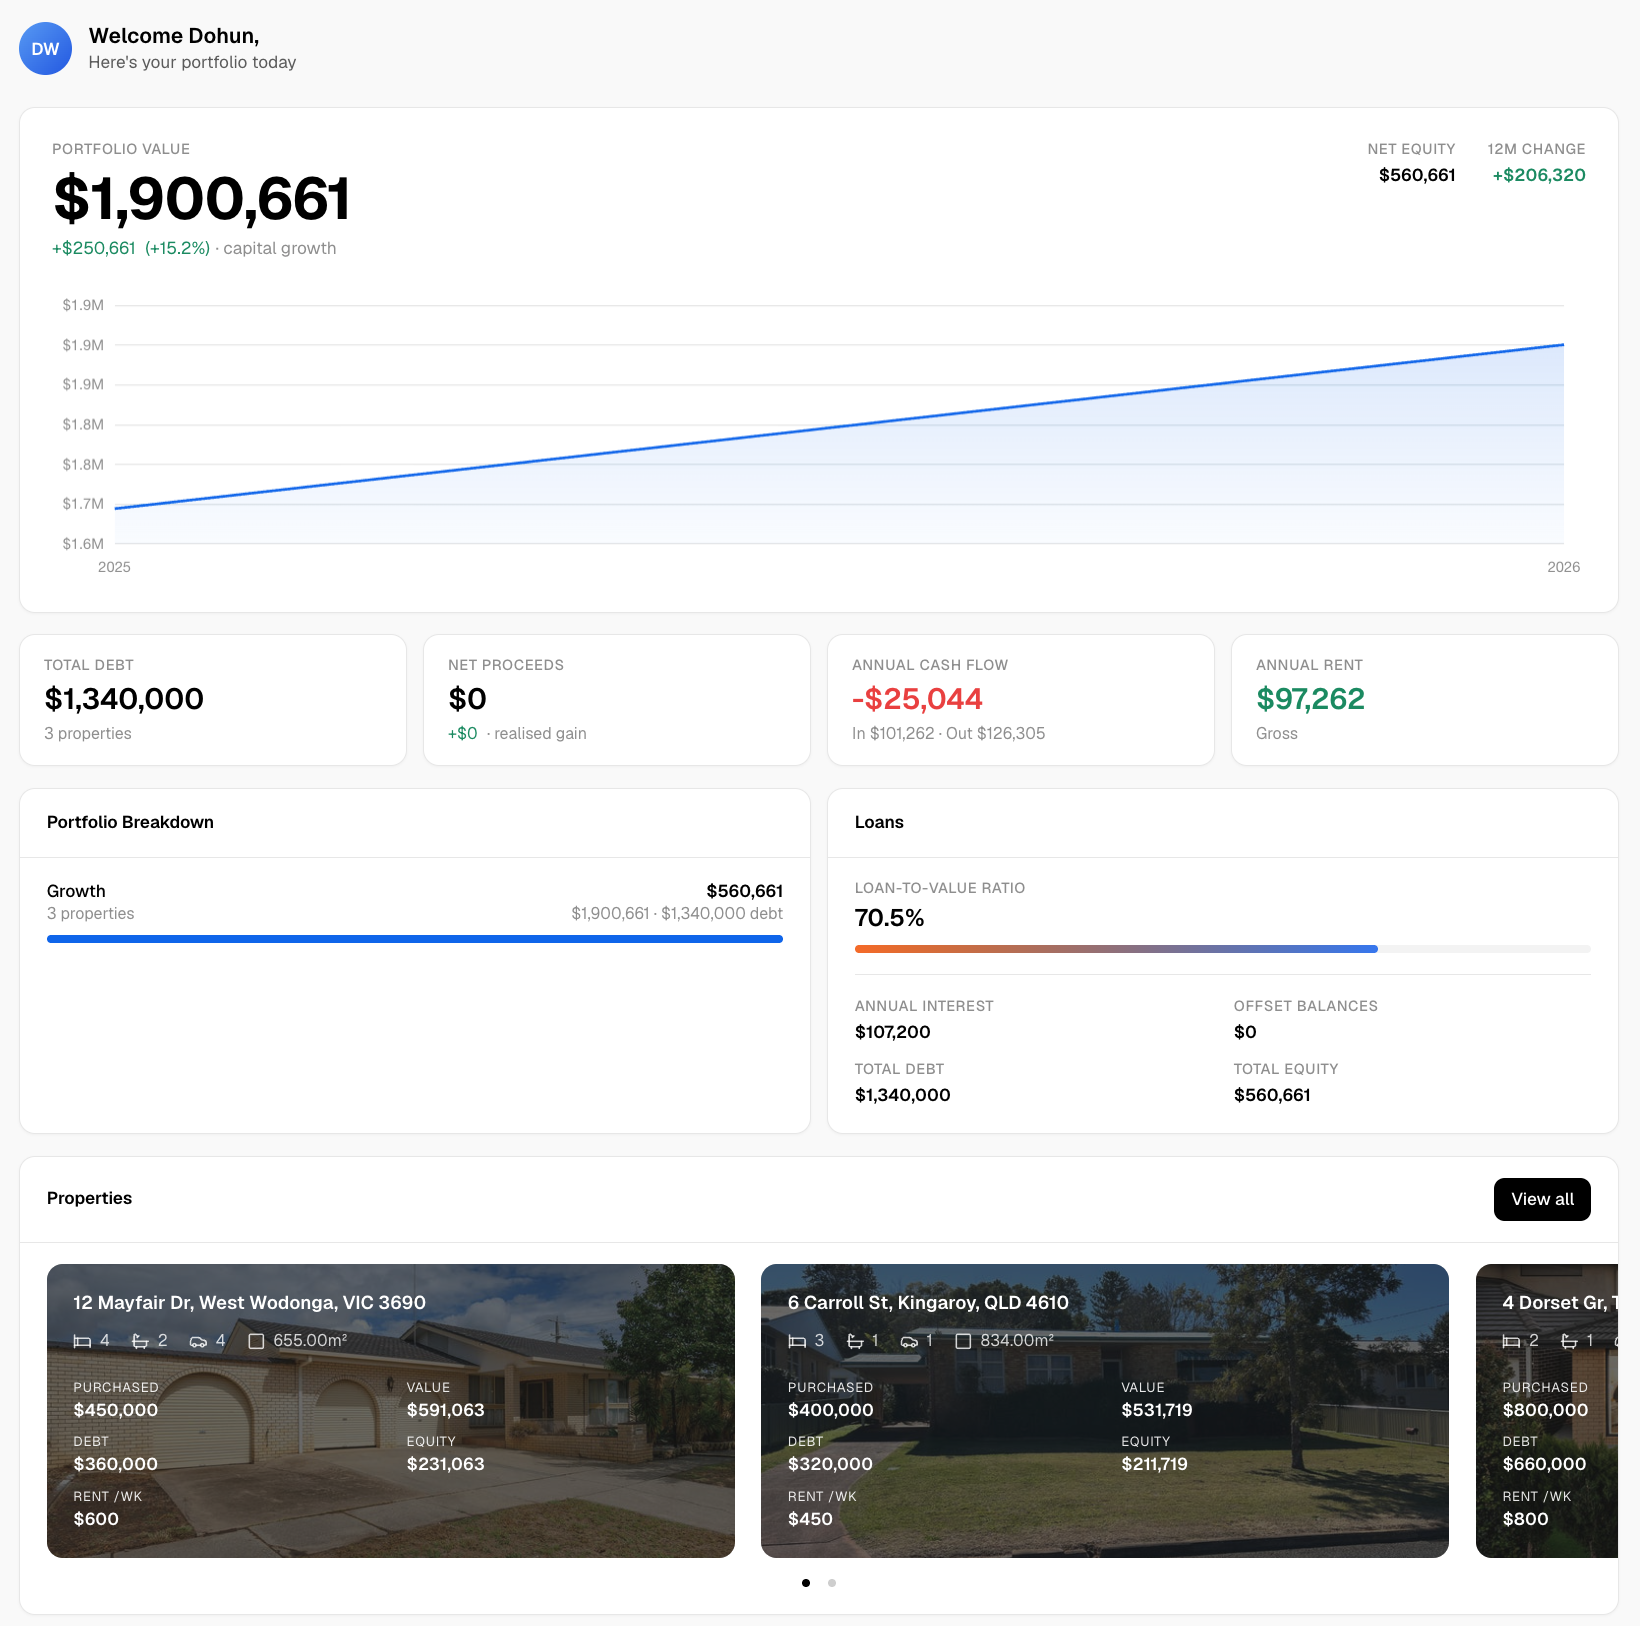
The platform’s free automated quarterly valuations track how a property’s value moves over time, and its suburb-level risk overlays let you check exposure alongside the market data you’re already using to compare suburbs. The real value comes in the modelling: run a rentvesting-versus-buying comparison with a higher insurance-cost scenario built in, and see how different properties might compare over a full investment horizon, not just at settlement. For anyone weighing up how a hazard-exposed asset fits a wider portfolio, our piece on passive property investment strategies is a useful companion read, and if you’re still working out your borrowing capacity under current lending rules, our breakdown of mortgage and credit score requirements covers how insurability can affect what a lender will approve.
Run your first suburb check and valuation on Wealthstacker before you make your next offer.
Sources
Before you sign anything, revisit the primary sources behind this guide:
- Australia National Climate Risk Assessment — full report (DCCEEW)
- Climate Council — Climate Risk Map of Australia
- Australian Water Outlook — projections (BOM)
Save screenshots of your results. They’re useful evidence in conversations with insurers, valuers, and lenders down the track.