
What investment modelling means for property professionals
TL;DR:
- Investment modelling forecasts property cash flow, equity, and returns using reliable Australian data sources. Automated tools like Wealthstacker enable scenario testing and faster portfolio planning, but manual verification remains essential. These models guide decisions such as purchase pricing, refinancing, and portfolio growth strategies for property investors.
Investment modelling, in the context of property investing, is the structured, data-driven process professionals use to forecast cash flow, equity growth, and total returns across multiple scenarios before committing capital. For Australian investors, that means running numbers through ATO-compliant tax treatments, CoreLogic-sourced valuations, and tools like Wealthstacker to screen deals faster, negotiate from a position of strength, and plan portfolio growth years ahead.
What you gain from a well-built model:
- Faster property screening without gut-feel guesswork
- Scenario-tested cash flow projections under rate shocks and rental slowdowns
- Portfolio-level equity forecasting to time your next acquisition
- After-tax holding cost clarity, including CGT and depreciation schedules
Automated valuation models (AVMs) such as CoreLogic RP Data typically produce estimates within 15% of actual sale prices roughly 90% of the time — useful for screening, but not for final offers.
Table of Contents
- What does investment modelling actually deliver for property investors?
- What inputs do professional models need, and where do you source them?
- Which modelling techniques do professionals actually use?
- How professionals run models in practice: stress testing, refinancing and portfolio planning
- How to set up a basic property investment model
- What does it cost and how long does it take?
- How Wealthstacker’s automated modelling works in practice
- Key takeaways
- Wealthstacker: automated valuations and portfolio modelling in one place
- Useful Australian sources for data, tax rules, and modelling
What does investment modelling actually deliver for property investors?
A model is only as useful as its outputs. Before making an offer, a professional investor expects to review a set of standard deliverables that turn raw property data into a decision.
Standard model outputs:
- Monthly and annual cash flow projections (rent minus mortgage, rates, insurance, management fees)
- Net Present Value (NPV) and Internal Rate of Return (IRR) for the full hold period
- Equity build-up schedule showing loan amortisation against capital growth
- Rent-growth versus expense-inflation comparison over 10+ years
- Breakeven analysis and hold/sell trigger points
| Output | What it tells you | Decision it drives |
|---|---|---|
| Monthly cash flow | Surplus or shortfall after all costs | Serviceability and buffer planning |
| NPV / IRR | Total return in today’s dollars | Buy, hold, or pass |
| Equity schedule | When usable equity becomes available | Timing of next acquisition |
| Breakeven point | Minimum rent or growth to avoid loss | Negotiating purchase price |
| Hold/sell trigger | Optimal exit based on CGT and growth | Timing a sale or refinance |
These outputs change real decisions. A negative cash flow projection might push you to negotiate a lower price or walk away entirely. An IRR comparison across two suburbs can settle a debate that gut feel never could. For rentvesting scenarios, the model also shows net worth trajectories side-by-side with a traditional buy-to-live approach.
What inputs do professional models need, and where do you source them?
The quality of a model’s outputs depends entirely on the quality of its inputs. Professionals draw from a specific set of authoritative Australian sources for each variable.

| Input | Authoritative Australian source |
|---|---|
| Interest rates / cash rate | RBA (rba.gov.au) |
| Rental yields and vacancy rates | SQM Research, Domain, CoreLogic |
| Capital growth benchmarks | CoreLogic, PropTrack |
| Stamp duty and land tax thresholds | State revenue offices (e.g. Revenue NSW, SRO Victoria) |
| Depreciation schedules (Div 40 / Div 43) | ATO, quantity surveyor reports |
| CGT discount rules and income tax rates | ATO (ato.gov.au) |
| Population and dwelling data | ABS (abs.gov.au) |
Mandatory inputs for any property model:
- Purchase price, settlement costs, and stamp duty
- Loan structure (LVR, interest rate, fixed vs variable, IO vs P&I)
- Gross rent, vacancy allowance, and property management fees
- Ongoing costs: council rates, insurance, maintenance, body corporate
- Depreciation: Division 40 (plant and equipment) and Division 43 (capital works)
- CGT assumptions on projected sale price and hold period
Pro Tip: Always separate cash-flow items from tax-deduction treatments. Division 40 and Division 43 affect taxable income and cash position differently — conflating them will misstate your weekly after-tax holding cost and give you a false read on serviceability.
A comprehensive property calculator covers stamp duty, loan serviceability, depreciation, CGT, and 10-year projections. Single-purpose calculators often omit one or more of these, which is where DIY models tend to fall short.
Which modelling techniques do professionals actually use?
Different decisions call for different methods. Professionals match technique to context rather than defaulting to one approach.
| Technique | Best use | When it adds real value |
|---|---|---|
| Discounted Cash Flow (DCF) | Single-property buy/hold decision | Long hold periods where timing of cash flows matters |
| IRR / NPV | Comparing two or more properties | Ranking competing opportunities by total return |
| Sensitivity analysis | Identifying key risk variables | Before finalising purchase price or loan structure |
| Scenario analysis | Rate shocks, rental falls, refinancing | Stress testing a plan against plausible adverse events |
| Monte Carlo simulation | Portfolio-level probability modelling | Large portfolios where variable interactions compound |
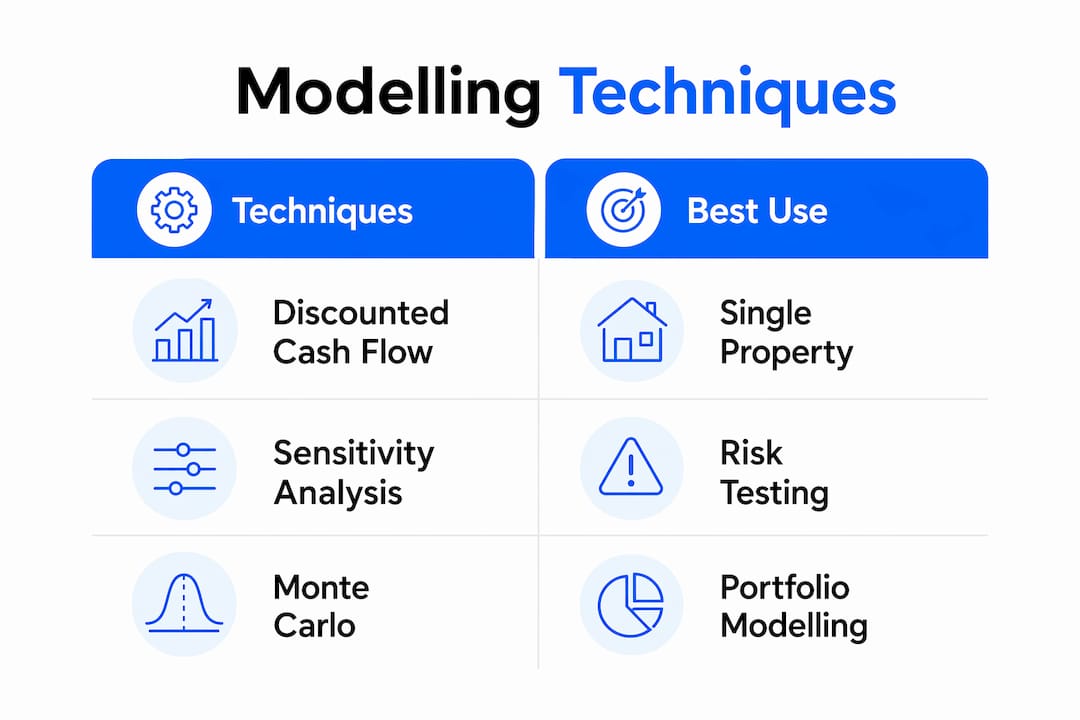
DCF is the workhorse for single-property decisions. You project all cash flows over the hold period, discount them at your required rate of return, and see whether the asset clears the bar. IRR adds a rate-of-return lens that makes cross-property comparisons cleaner.
Sensitivity analysis is where many investors underinvest. Running a model at base-case assumptions feels reassuring; running it with a 1.5% rate rise and a 10% rental vacancy reveals whether the deal still works. Scenario-based modelling is how serious investors stress-test 10-year plans against variables that gut feel cannot price.
Monte Carlo simulation is overkill for a single property but genuinely useful when you are modelling a portfolio of five or more assets, where the interaction between growth rates, vacancy, and interest costs creates compounding uncertainty. AI platforms now handle large-scale data processing for suburb screening and scenario analysis at a speed no single analyst can match manually.
How professionals run models in practice: stress testing, refinancing and portfolio planning
A professional workflow follows a consistent sequence regardless of the tool used.
- Data gathering: Pull purchase price, comparable rents (SQM/Domain), vacancy rates, and interest rate benchmarks (RBA).
- Build the baseline model: Enter all inputs, set a 10-year horizon, and calculate base-case cash flow and equity.
- Run scenario tests: Apply a rate shock (+1.5–2%), a rental growth slowdown (flat for 2 years), and a refinancing event (revert rate, LMI recalculation).
- Interpret results: Identify which scenarios push cash flow negative and by how much. Flag any that breach serviceability.
- Act on the output: Negotiate a lower price, restructure the loan, adjust the deposit, or walk away.
At the portfolio level, the workflow extends to equity recycling — modelling when usable equity from Property 1 can fund the deposit on Property 2 — and concentration risk checks to avoid overexposure to one suburb or property type. Portfolio-level tools show how cash flow and equity across properties interact and reveal long-term net worth trajectories that single-property models cannot surface.
Pro Tip: Cross-check every AVM output against at least three recent comparable sales within 500 metres and the same property class. AVMs are reliable screening tools but carry an error band — treat them as indicative, not final.
AI-driven due diligence compresses traditional 40–80 hour research workflows into 15–25 hours by automating data aggregation and financial modelling. The remaining hours are where human judgement earns its keep: physical inspection, contract review, and local market context that no algorithm has yet priced correctly.
How to set up a basic property investment model
- Collect all inputs — purchase price, stamp duty, loan terms, gross rent, vacancy allowance, operating costs, depreciation schedule, and CGT assumptions.
- Choose a time horizon — 10 years is the professional standard for a buy-and-hold model.
- Build the cash flow schedule — model each year’s income, expenses, interest, and principal repayment.
- Layer in depreciation and tax — apply Div 40 and Div 43 separately; calculate after-tax cash position for each year.
- Calculate KPIs — NPV, IRR, weekly after-tax holding cost, and equity at end of hold period.
- Validate — check interest serviceability at a stressed rate, verify rent and vacancy against SQM or Domain, and compare AVM outputs to recent sales.
Validation red flags to watch for:
- Rent assumptions more than 5% above current median for the suburb
- Vacancy below the suburb’s 12-month average
- Capital growth assumptions above long-run historical averages without a specific catalyst
- Depreciation claims not supported by a quantity surveyor report
Pro Tip: A dedicated modelling tool is worth the cost for multi-property portfolios and multi-year projections. The basic ATO worksheet suits single-property EOFY recordkeeping — it was not built for scenario testing or portfolio planning.
A DIY spreadsheet takes 1–2 days to build for a single property and several weeks to extend across a portfolio. A subscription tool cuts that to hours for the initial setup. The biggest time sink is usually sourcing and verifying inputs, not the modelling itself.
What does it cost and how long does it take?
| Route | Typical setup time | Indicative cost range |
|---|---|---|
| DIY spreadsheet (single property) | 1–2 days | Nil to low (template cost) |
| Subscription modelling tool | 2–4 hours initial setup | Varies by platform; check provider |
| Professional adviser (project basis) | 1–2 weeks | Adviser hourly or project rate |
| Portfolio model (multi-property) | 2–4 weeks | Higher; depends on complexity |
The tasks that drive cost upward are custom tax and depreciation schedules, scenario testing across multiple properties, and validation against live market data. Interest-rate sensitivity modelling adds another layer of complexity when borrowing power shifts materially with each rate move.
A subscription tool is the right call when you are building beyond two properties or running quarterly updates. For a one-off acquisition decision, a well-structured spreadsheet with verified inputs often does the job.
How Wealthstacker’s automated modelling works in practice
Wealthstacker runs automated quarterly valuations using an AVM feed, which updates each property’s estimated value without manual data entry. That updated valuation flows directly into the personalised model, refreshing equity position, LVR, and net worth projections automatically.
What the platform models per property:
- Current AVM-based valuation and equity position
- Cash flow timeline with rent, costs, and loan repayments
- Scenario toggles: interest rate shock, rental growth slowdown, refinancing event
- Projected net worth at 5 and 10 years under each scenario
| Scenario toggle | Input changed | Output surfaced |
|---|---|---|
| Rate shock (+1.5%) | Interest rate | Revised monthly shortfall and serviceability |
| Rental slowdown (flat 2 yrs) | Rent growth rate | Cash flow impact and breakeven shift |
| Refinancing event | Revert rate + LMI | Net cost of refinancing vs staying |
Automated modelling accelerates the research phase and surfaces assumption drift before it becomes a financial problem — but it does not replace a physical inspection, a solicitor’s contract review, or a conversation with a registered tax agent about your specific circumstances. The model is the starting point for a better-informed decision, not the final word.
Wealthstacker flags when AVM outputs diverge materially from recent comparable sales, prompting a manual review. That cross-check discipline — AI tools for property valuation plus human verification — is what separates a reliable model from a confident-looking spreadsheet that misleads you. AI platforms allow broader screening and faster analysis, but success depends on integrating that output with local expertise.
Key takeaways
Investment modelling gives Australian property investors a structured, data-driven process to forecast cash flow, equity, and returns under multiple scenarios — and automated tools like Wealthstacker make that process faster and more consistent than any manual spreadsheet.
| Point | Details |
|---|---|
| Definition | Investment modelling forecasts cash flow, equity, and returns across multiple scenarios using verified data inputs. |
| Core inputs | Purchase price, loan terms, rent, vacancy, Div 40/43 depreciation, stamp duty, and CGT assumptions are all mandatory. |
| Essential techniques | DCF and IRR for single-property decisions; scenario analysis and sensitivity testing for stress testing; Monte Carlo for portfolios. |
| Validation rule | Always cross-check AVM outputs against recent comparable sales — AVMs are indicative, not final. |
| Wealthstacker | Automates quarterly valuations and scenario modelling, surfacing assumption drift and net worth projections without manual data entry. |
Wealthstacker: automated valuations and portfolio modelling in one place
Most investors spend more time gathering data than actually modelling it. Wealthstacker flips that ratio by delivering automated quarterly valuations at no cost, feeding them directly into a personalised model that tracks cash flow, equity, and projected net worth across your entire portfolio.
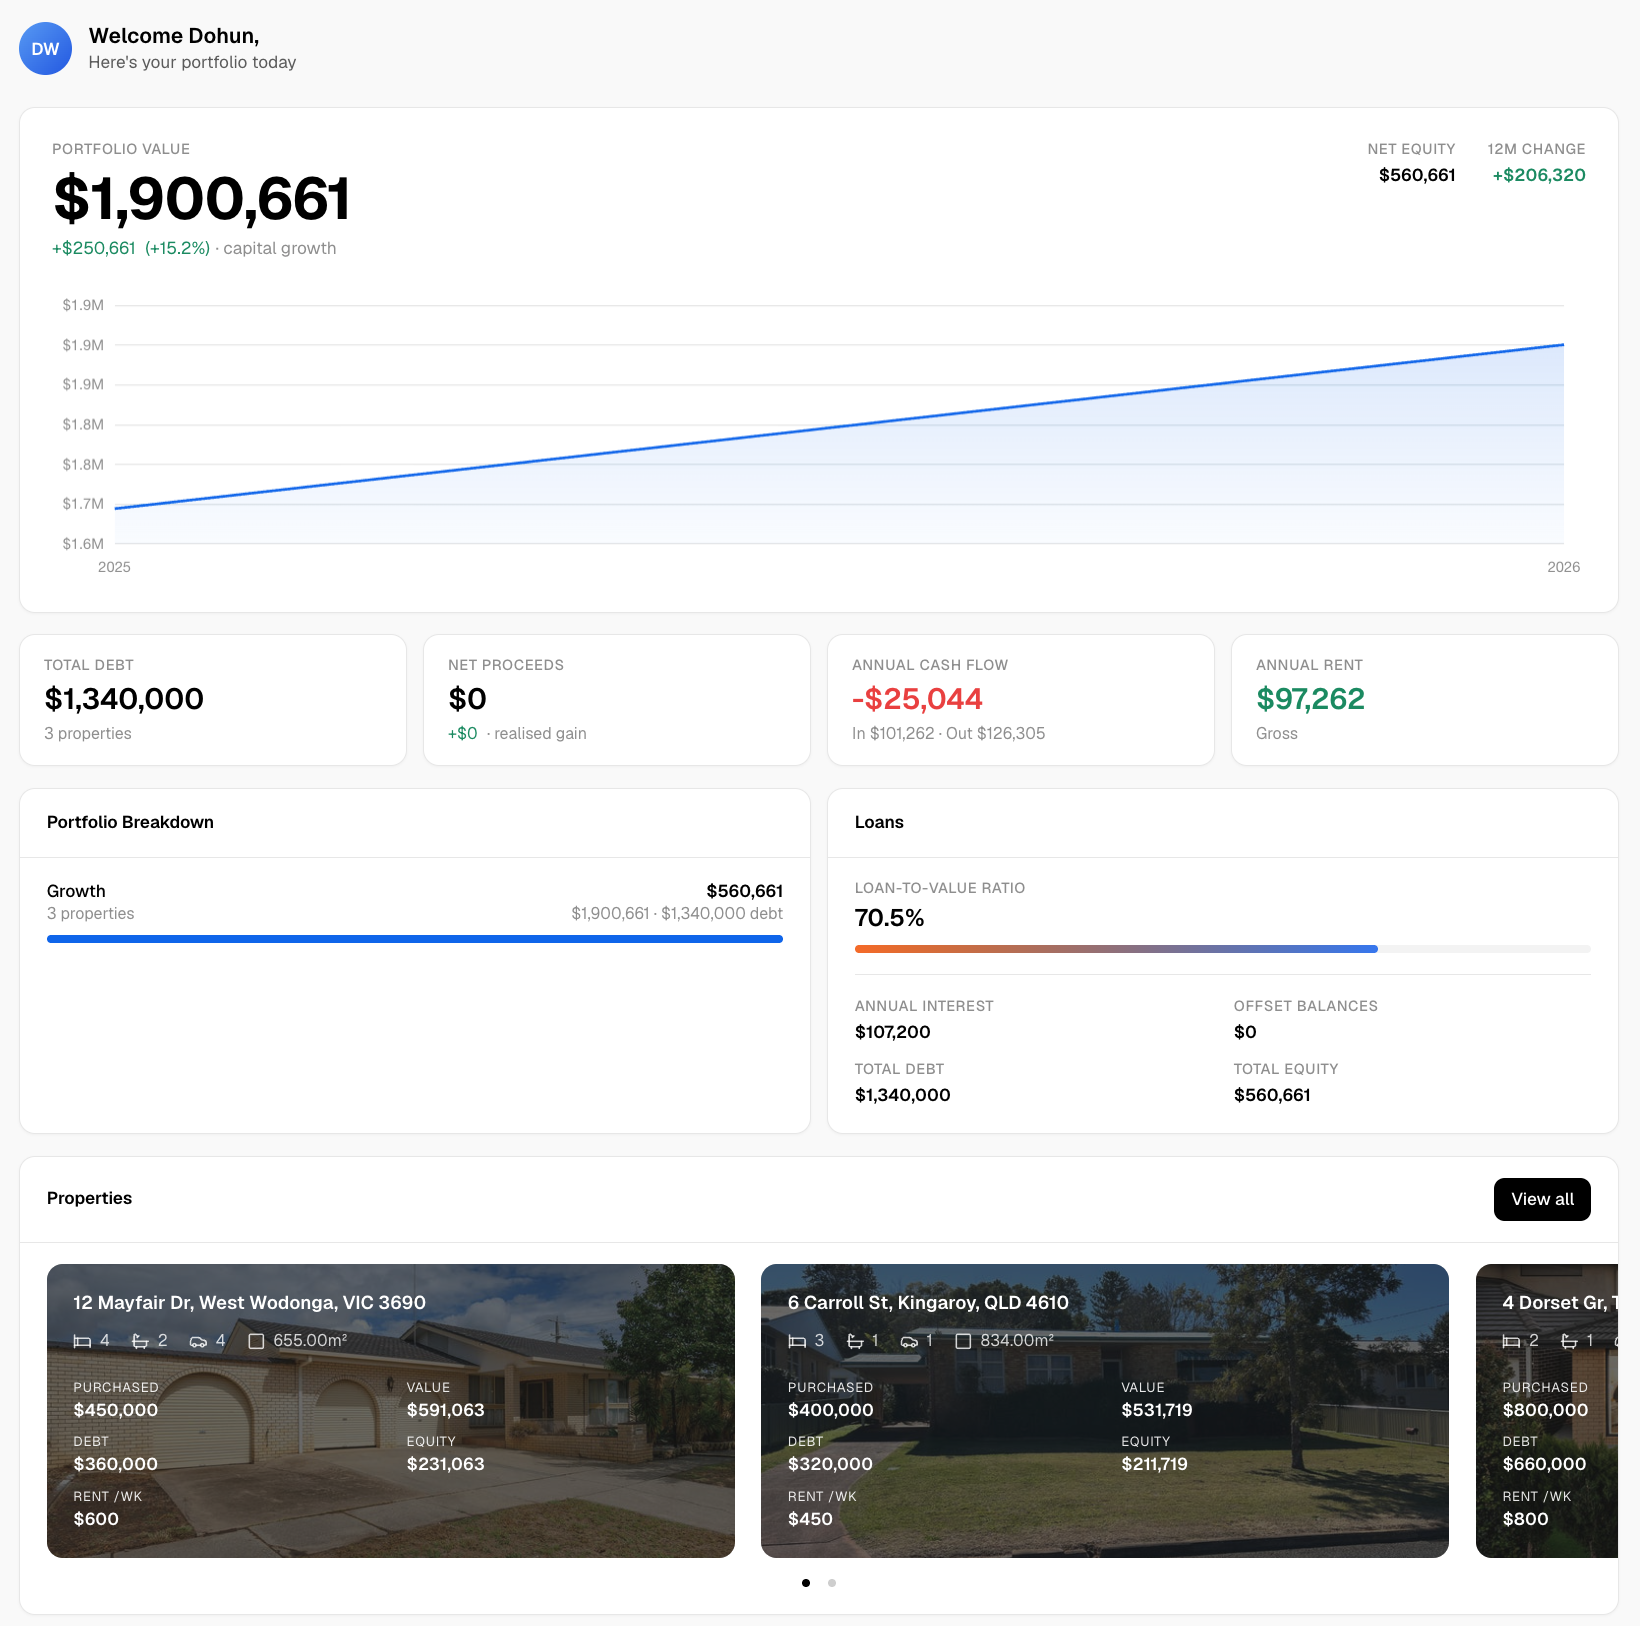
The platform suits investors building multi-property portfolios, rentvestors comparing strategies, and anyone who wants scenario-tested projections without paying adviser fees for every what-if question. For complex tax structuring or contract review, a registered adviser remains the right call — Wealthstacker handles the modelling layer so those conversations start from a position of clarity rather than guesswork.
Start modelling your portfolio with automated quarterly valuations and scenario toggles built for Australian property investors.
Useful Australian sources for data, tax rules, and modelling
- ABS (abs.gov.au): Population, dwelling approvals, and economic indicators for growth assumptions
- RBA (rba.gov.au): Cash rate, interest rate history, and economic outlook for rate benchmarks
- ATO (ato.gov.au): Division 40/43 depreciation rules, CGT discount, and income tax rates
- CoreLogic / PropTrack: AVM data, suburb-level capital growth, and rental yield benchmarks
- SQM Research / Domain: Vacancy rates and rental market data for income assumptions
- State revenue offices: Stamp duty calculators and land tax thresholds (Revenue NSW, SRO Victoria, OSR Queensland, and equivalents)
- Wealthstacker blog: Practical guides on AI-enabled forecasting methods, portfolio tracking, and portfolio diversification strategies
For interest rate benchmarks, use the RBA’s published cash rate and the major banks’ standard variable rates. For vacancy and rent, SQM Research publishes suburb-level data updated monthly. For depreciation, always obtain a quantity surveyor report rather than estimating Div 40/43 splits yourself.
This article provides general information only and is not personal financial, tax, or investment advice. Confirm current rates, thresholds, and rules with the ATO, your state revenue office, or a registered professional for your specific situation.