
Automated property valuation models: an investor’s guide
TL;DR:
- Automated property valuation models provide quick estimates and confidence metrics but are best used for screening purposes. They are less reliable for unique, contested, or low-sale-volume properties, requiring manual review for accuracy. Australian investors should rely on AVMs for routine monitoring, always verify confidence scores, and supplement with formal valuations when necessary.
An automated property valuation model (AVM) is a statistical or machine-learning system that estimates a property’s market value using data alone, with no physical inspection. It runs in seconds and returns three things you actually need: a point estimate, a value range, and a confidence metric.
Here is the investor verdict upfront: treat AVM outputs as a triage and screening tool, not as your final bid anchor or a legally compliant valuation. For standard suburban stock and portfolio monitoring, they are genuinely useful. For unique assets, contested auctions, or anything with unrecorded improvements, commission a formal valuation before you commit.
Typical AVM outputs at a glance:
- Point estimate — the model’s single best-guess market value
- Value range — upper and lower bounds reflecting data uncertainty
- Confidence score or FSD — Forecast Standard Deviation; a lower FSD means tighter, more reliable estimates
- Comparable set metadata — the sales the model used, with distance and recency flags
Table of Contents
- How does an automated property valuation model produce a number?
- How accurate are AVMs, and what does Australian regulation say?
- When should Australian investors rely on AVMs, and when shouldn’t they?
- A step-by-step workflow for using AVM outputs safely
- What should you look for when choosing an AVM tool in Australia?
- How human intervention makes AVM outputs more reliable
- How Wealthstacker delivers automated valuations for Australian investors
- Key takeaways
- Wealthstacker: quarterly automated valuations, built for investors
- Useful sources
How does an automated property valuation model produce a number?
AVMs pull from several data layers simultaneously: recent settled sales, active listings, land size, building attributes, council zoning overlays, tenure type, rental records, and temporal adjustment factors that account for market movement since each comparable sale.
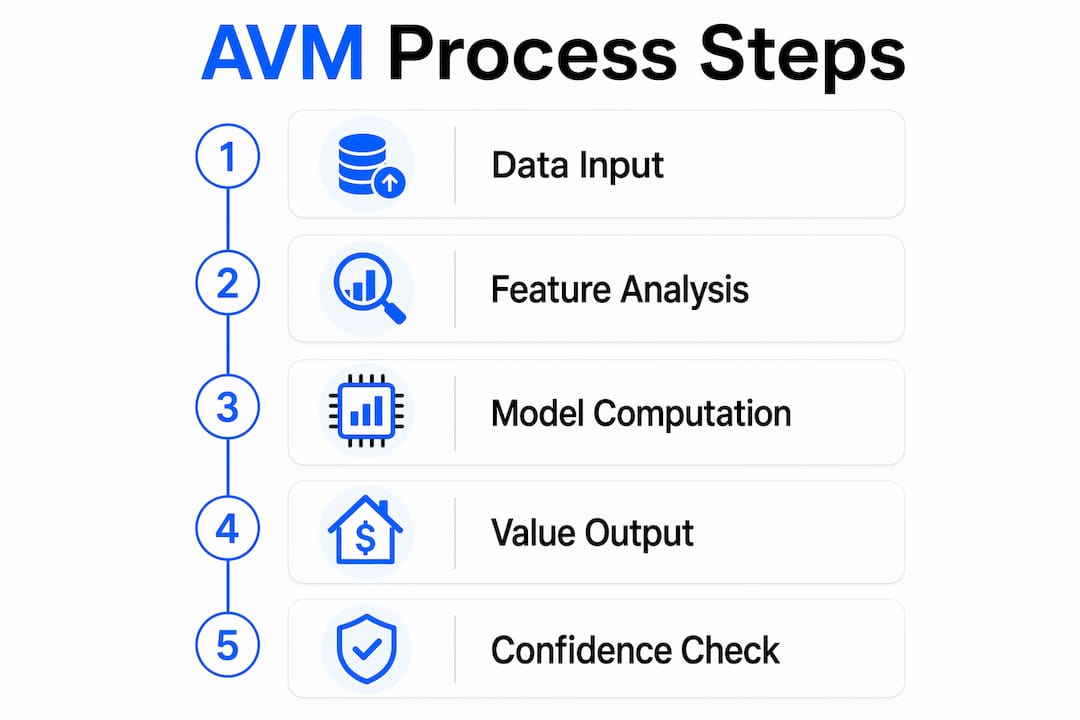
The modelling approaches vary by provider. Hedonic regression assigns a dollar weight to each property attribute (bedrooms, land size, aspect) and sums them. K-nearest neighbours finds the most similar recent sales and interpolates. Tree-based learners and ensemble ML methods combine hundreds of decision rules to handle non-linear relationships between attributes and price. Most production AVMs blend several of these into a hybrid model with heuristic filters that flag or exclude outlier sales.
| Output field | What it means for you |
|---|---|
| Point estimate | The model’s central value prediction — use as a reference, not a ceiling |
| Value range (low–high) | The band within which the true value likely sits; bid strategy should reference this band |
| FSD / confidence score | Lower FSD = tighter range = more data; high FSD signals thin comparable market |
| Comparable sales list | The actual transactions driving the estimate; check recency and distance |
| Data timestamp | When the underlying sales data was last refreshed; stale data widens error |
How accurate are AVMs, and what does Australian regulation say?
Online AVM estimates carry an error margin of roughly 10–20% under normal market conditions. Vendors sometimes claim around 90% of estimates fall within 15% of the eventual sale price, but that figure is a vendor claim and varies significantly by suburb density and data quality. In thin or volatile markets, the real spread can be wider.
Where AVMs break down:
- Thin comparable markets — rural blocks, prestige suburbs, and low-turnover postcodes simply lack the sales volume models need
- Unique improvements — a bespoke renovation or heritage overlay that is not recorded in council data is invisible to the algorithm
- New-build distortions — developer incentives and GST adjustments can poison comparable sets and push estimates for nearby established stock higher than they should be
- Hidden encumbrances — easements, flood overlays, and restrictive zoning are frequently absent from sales datasets, creating valuation gaps between otherwise similar properties
Statistic to note: Academic research on the Australian mortgage market cites AVM variance from actual market values of 5–18% depending on property type and data coverage.
On the regulatory side, IVS 105 requires a valuer’s professional judgement to assess property condition and local nuances — meaning AVMs alone cannot produce an IVS-compliant valuation. APRA has flagged AVMs as material to loan processing and highlighted model risk, supplier concentration, and assurance gaps. In practice, a low confidence score will often trigger a mandatory physical valuation from your lender.
Pro Tip: A wide FSD is not a flaw to ignore — it is the model telling you the data is thin. When the confidence band spans more than 15% of the point estimate, treat the output as directional only and plan for a desktop or full valuation before proceeding.
When should Australian investors rely on AVMs, and when shouldn’t they?
AVMs are strong for standard suburban housing and high-volume mortgage workflows. They struggle with unique or contested assets.
Good fit:
- Screening a shortlist of 20 suburbs for yield and capital growth potential
- Quarterly portfolio revaluation across multiple standard residential holdings
- Pre-refinancing sanity check before engaging a broker
- Lender triage for standard loan workflows
Poor fit:
- Heritage or architecturally unique dwellings with non-standard improvements
- Rural or semi-rural blocks with fewer than five comparable sales in 24 months
- Commercial or mixed-use properties where developer incentives distort the comparable set
- Any property where you plan to bid at auction and the result is genuinely contestable
For portfolio monitoring, quarterly AVM updates are the practical standard. If you are active in a fast-moving market, monthly checks are worth the effort. The key is consistency: same tool, same timestamp, so drift in your portfolio value is comparable period to period.
A step-by-step workflow for using AVM outputs safely
- Confirm data recency — check when the comparable sales were last refreshed. Data older than six months in a moving market degrades the estimate materially.
- Read the confidence score and comparable list — a high-confidence score with recent, nearby comparables is a green light for screening; a low score with distant or old sales is a yellow flag.
- Adjust mentally for visible improvements or overlays — if you know the property has a new kitchen or sits in a flood zone, the AVM does not. Factor that gap into your range.
- Cross-check with a forensic comparable quick-check — pull the three most recent sales within 500 metres and the same property type yourself. If they cluster near the AVM estimate, confidence rises.
- Commission a physical valuation when confidence is low or the deal is contested — lenders will often require this anyway when the AVM confidence score falls below their internal threshold.
Use the value range, not the point estimate, when structuring an offer. Set your walk-away price at or below the low end of the band. Document every AVM output with a timestamp and a screenshot of the comparable set — this matters for investment reporting and for any future dispute with a lender or accountant.
Pro Tip: If the AVM range on a property is large relative to its value, anchor your offer to the more conservative end of the range. You are buying the uncertainty, not just the asset.

What should you look for when choosing an AVM tool in Australia?
Not all AVM providers are equal. The questions below cut through marketing claims quickly.
- Data coverage and update frequency — does the provider include deed data, land size, building permits, and council overlays? How often does the comparable set refresh?
- New-build and incentive handling — does the model flag or exclude developer sales to avoid skewed pricing?
- Validation and benchmarking — has the provider published back-testing results or independent error metrics? Vendor accuracy claims without methodology are marketing, not evidence.
- Transparency — can you see the comparable list, the adjustment logic, and the confidence score? A black-box estimate is hard to defend to a lender or a co-investor.
- Human override pathways — can an analyst or valuer manually select or exclude comparables and publish an adjusted output?
| Provider attribute | Why it matters |
|---|---|
| Suburb-level turnover threshold | Low-turnover suburbs need a minimum comparable count policy |
| Published error metrics | Lets you benchmark the tool against the 10–20% industry norm |
| Comparable list transparency | Required for hybrid workflows and lender submissions |
| API or export capability | Needed for portfolio-scale tracking and accountant reports |
| Refresh cadence SLA | Quarterly minimum; monthly preferred for active portfolios |
AI tools are also reshaping brokerage productivity in ways that flow through to AVM data quality — brokers who adopt AI workflows tend to generate cleaner transaction records, which feeds better comparable sets downstream.
How human intervention makes AVM outputs more reliable
Practitioners report materially better outputs when an expert selects or excludes specific comparable sales rather than accepting the algorithm’s default set. The hybrid workflow most firms use looks like this:
- Run the automated model across the full portfolio or candidate list.
- Flag low-confidence outputs for valuer review.
- For flagged properties, a valuer manually reviews the comparable set, excludes outliers or developer sales, and adjusts for non-recorded improvements.
- The valuer’s name stays on the final report for IVS accountability, even when the AVM did the heavy lifting.
Frontier AI models can now surface long histories of internal valuation reports for on-demand context, but they still hallucinate in a non-trivial share of responses. That is precisely why the valuer’s review step is not optional — it is the error-correction layer. AI tools in property valuation work best when they augment judgement, not replace it.
Pro Tip: If you are planning to bid at auction or structure significant leverage against a property, always request the hybrid option — automated screening followed by a valuer’s comparable review. The cost difference is small; the risk reduction is not.
How Wealthstacker delivers automated valuations for Australian investors
Wealthstacker is built around the practical needs of Australian property investors who want AVM-grade speed without sacrificing the transparency that makes outputs actually usable.
What the platform provides:
- Quarterly automated valuations at no cost, refreshed on a consistent schedule
- Portfolio tracking across multiple properties with comparable-set visibility
- Confidence scores surfaced alongside each estimate so you can triage immediately
- Exportable reports formatted for lenders, accountants, and co-investors
- Integration with financial modelling tools for net-worth forecasting and path planning
Getting started takes three steps: sign up at Wealthstacker, import your existing assets, and run your first quarterly valuation. From there, the platform layers in wealth planning and rentvesting scenario modelling so your AVM outputs feed directly into borrowing power and net-worth projections — not just a standalone number.
Key takeaways
AVMs are a triage tool: always check the confidence score and comparables, use hybrid workflows for contested assets, schedule quarterly revaluations, and anchor your offer strategy to the value range, not the point estimate.
| Point | Details |
|---|---|
| AVMs are a triage layer | Use automated valuations for screening and monitoring; commission a formal valuation for complex or contested assets. |
| Confidence score is the signal | A wide FSD or low confidence score means thin data — treat the output as directional only. |
| Hybrid workflows reduce risk | Human comparable review materially improves outputs; IVS 105 requires valuer judgement for a compliant valuation. |
| Quarterly cadence is the standard | Update portfolio valuations every quarter; more frequently in fast-moving markets. |
| Wealthstacker automates the cycle | Quarterly automated valuations, confidence scores, and portfolio tracking are available at no cost through Wealthstacker. |
Wealthstacker: quarterly automated valuations, built for investors
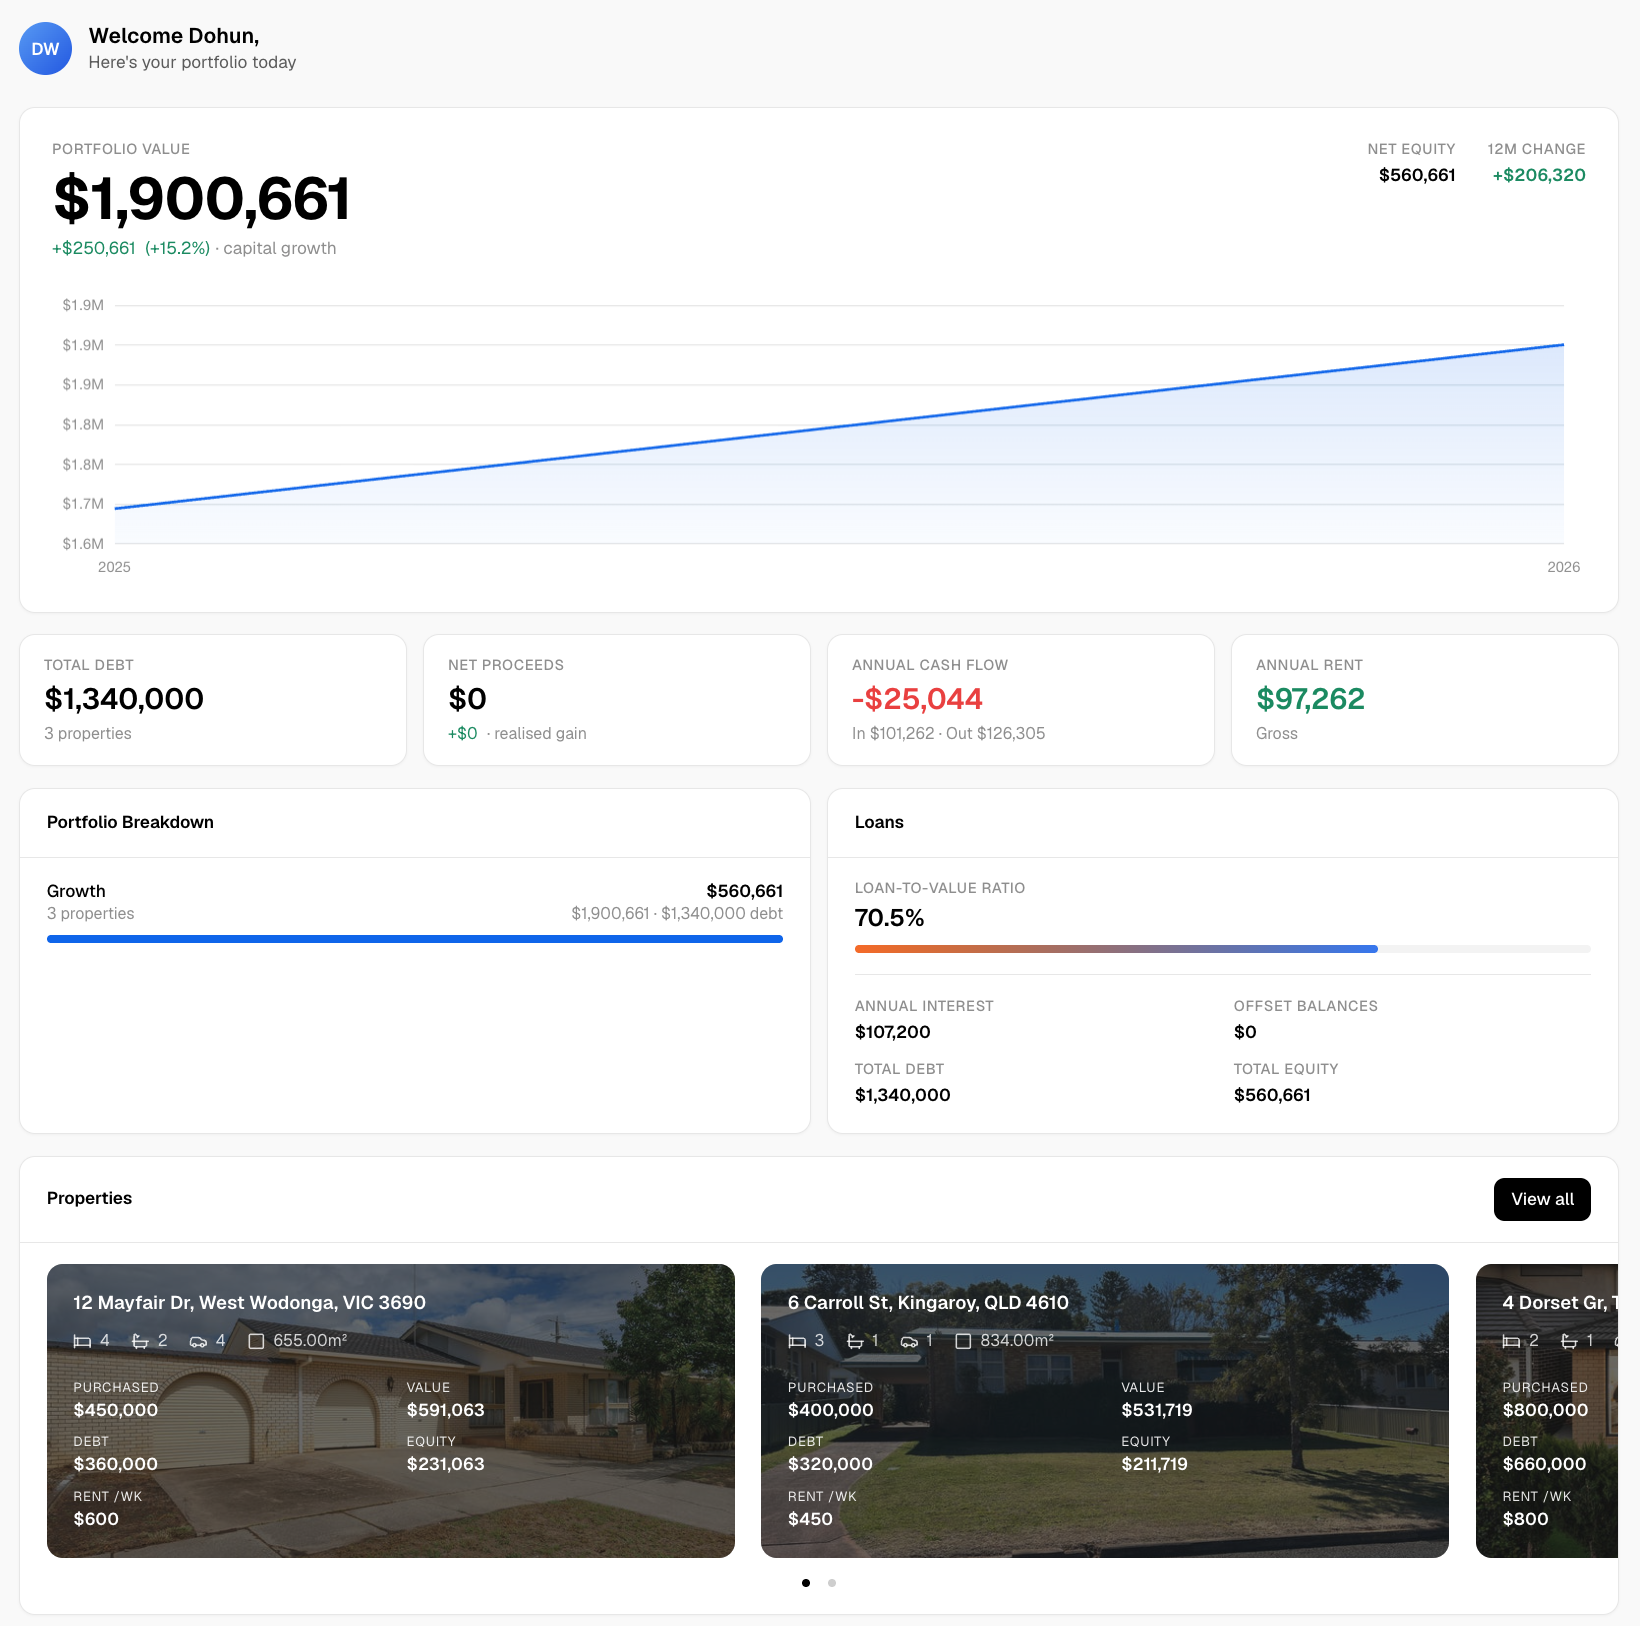
Wealthstacker gives Australian property investors something most platforms do not: quarterly automated valuations at no cost, paired with portfolio tracking and wealth planning in one place. The difference is not just speed. Every valuation comes with a confidence score and comparable-set visibility, so you are never working from a black-box number. Outputs feed directly into net-worth forecasting and rentvesting scenario modelling, turning a standalone estimate into a decision-ready input. If you are managing more than one property or planning your next acquisition, start tracking your portfolio with Wealthstacker today.
Useful sources
- The increasing use of Automated Valuation Models in the Australian mortgage market — academic analysis of AVM adoption, accuracy variance (5–18%), and limitations in the Australian lending context.
- Navigating the rise of AI in valuation: opportunities, risks and standards | Leeson Valuers — practitioner commentary on IVS 105 and why AVMs require valuer oversight to be compliant.
- When the algorithm picks the price: APRA’s AI letter puts AVMs in the spotlight | AusProperty.news — covers APRA’s model risk guidance and how low AVM confidence triggers physical valuations in lending workflows.
- How to value a property in Australia | PropertyPrinciples — practical overview of AVM error ranges, new-build distortions, and hidden encumbrances.
- AI in property valuation, Mid-2026 | Perth AI Consulting — industry commentary on AVM use cases, frontier model hallucination risk, and hybrid workflow best practice.
- How automated valuation models can help reduce underquoting | National Property Group — practitioner evidence on how human comparable selection improves AVM outputs.
- Automated Valuation Model explained | Uno Home Loans — clear explanation of FSD, confidence scores, and how lenders interpret AVM outputs.